Vertical datum chart references
All navigational charts require a vertical datum reference alongside the positioning of a horizontal datum system.
On this page
About chart datum
Surveyed features on a navigational chart are positioned on a horizontal datum system like the:
- North American Datum of 1927 (NAD27)
- North American Datum of 1983 (NAD83)
For navigational safety, depths on a chart are shown from a low water surface or a low water datum called chart datum. Chart datum is selected so that the water level will:
- seldom fall below it
- rarely have less depth available than what’s portrayed on the chart
The following criteria place somewhat more restriction on its choice since chart datum should:
- be so low that the water level will seldom fall below it
- not be so low as to cause the charted depths to be unrealistically shallow
- vary only gradually from area to area and from chart to adjoining chart, to avoid significant discontinuities
On most Canadian coastal charts, the surface of lower low water, large tide (also known as LLWLT) has been adopted as chart datum. But the term lowest normal tide (also called LNT) has been retained on the charts. This is because it encompasses a variety of other choices for chart datum on some older charts.
The choice of a chart datum is usually more difficult on inland waters than on coastal waters. This is because inland waters lack the stabilizing influence the huge ocean reservoir exerts on the mean water level.
A 2-month water level record at a coastal location may provide sufficient tidal information to determine a reasonably accurate chart datum. However, many years of records may be necessary to provide the information on seasonal and secular fluctuations in mean water level required to determine chart datum on lakes and rivers.
In non-tidal waters, chart datum is set so that the water level will be above datum approximately 95% of the time. A preferred guideline is that the daily mean water level should never fall more than 0.2 m below the chart datum during the navigation season.
Water level
The water level of a lake or river is always changing due to variations in supply and discharge, or in meteorological conditions. Dry and wet periods in many drainage basins such as the Great Lakes seem to occur in several-year cycles. This causes corresponding periods of low and high water.
Chart datum must be set with the low-stage years in mind and may appear pessimistically low during high-stage years. On most lakes, a single, level surface is adopted as chart datum over the whole lake. Along a river, chart datum is a sloping surface that approximates the slope of the river surface at low stage.
Non-tidal waters
In non-tidal waters, chart datum is often assigned an elevation on a vertical reference system. On the Great Lakes, water level and chart datum elevations are presently referenced to International Great Lakes Datum 1985 (IGLD 1985). This is reflected in Figure 1. Some of the previous vertical reference systems used for charting on the Great Lakes include:
- IGLD 1955
- USLS 1903 (U.S. Lake Survey 1903 Datum)
- USLS 1935
A new reference system is required approximately every 25 to 30 years to correct for differential movement of the earth's crust in the Great Lakes region.
IGLD 1985 was implemented in January 1992 and replaced the previous system, IGLD 1955. Since the plane of chart datum wasn’t changed, the depths and heights portrayed on the charts are the same for both reference systems. However, the elevation assigned to chart datum is slightly different.
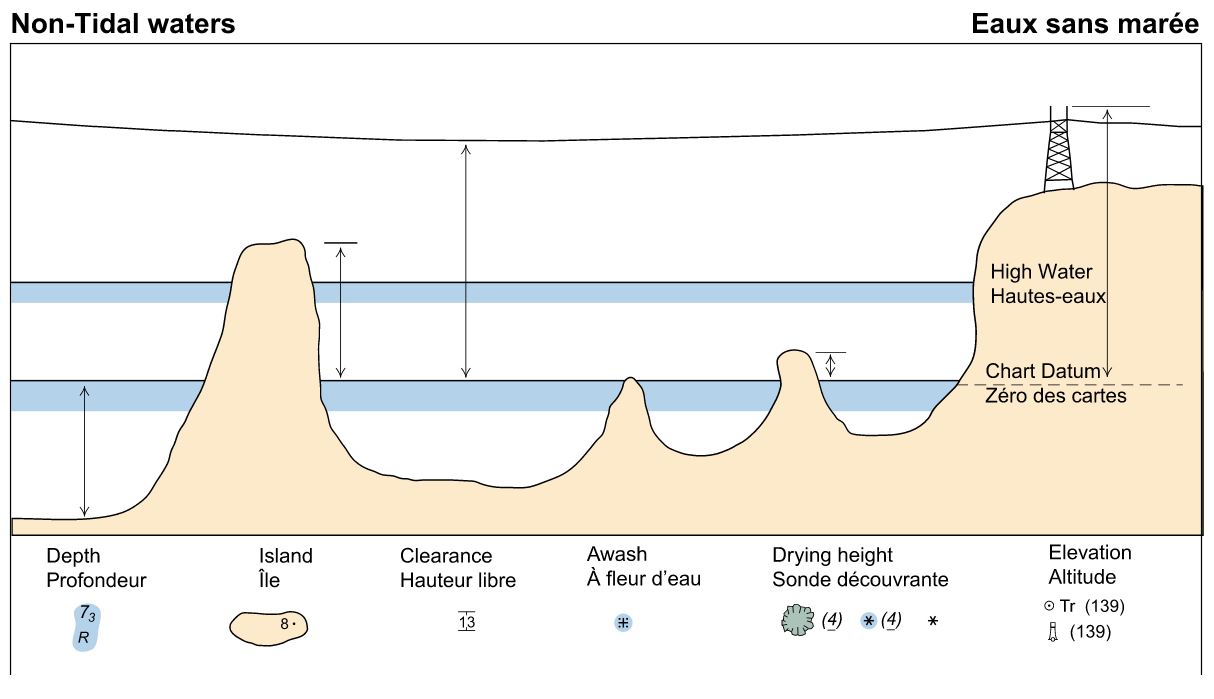
Nautical charts also require a high water line which is used to define some vertical features and the shoreline on a chart. The high water line is selected as a level above which the water will seldom rise. For example, a level of 1.3 m above chart datum is used for the high water line on the Canadian Hydrography Service (CHS) charts of Lake Ontario and Lake Erie.
As features on a chart, a:
- depth falls below chart datum
- rock awash is at chart datum
- drying height falls between chart datum and the high water line
- height is above the high water line
This information is shown graphically on page 36 in the current CHS Chart Number 1 publication, as reflected in Figure 2 and Figure 3. The publication explains all of the symbols, abbreviations and terms used on navigational charts.
Tidal waters
In tidal waters, clearances, elevations and heights of islands are given above high water (Figure 2). In non-tidal waters, such as the Great Lakes, heights of islands, clearances, elevation of lights and drying heights are given above chart datum (Figure 3).
Therefore, a knowledge of the present water level relative to chart datum is required to correct these charted heights and all depths to the current conditions. For example, a clearance of 9 m on an inland chart will only be 8 m when the water level is 1 m above chart datum.
Water level gauges
Water level gauges are referenced to the same vertical datum that is used for charts. To inform the mariner of the possible range of water level fluctuations, a hydrograph (Figure 4) is included on non-tidal charts to show:
- the average water level
- extreme levels for each month from historical observations
Up-to-date water level information for the Great Lakes is available:
- on marine broadcasts as weekly averages
- from water level bulletins as monthly averages

